Monitoring
1. Introduction
Monitoring is a crucial aspect of maintaining the health and performance of software systems. It involves observing the behavior of a system and its components over time to ensure they are functioning as expected. Monitoring provides insights into the system’s performance, helping developers identify and resolve issues before they escalate into critical problems.
In the context of software development, monitoring often involves the collection of three types of data: metrics, logs, and traces. These are collectively known as the three pillars of observability, providing a comprehensive view of a software system’s behavior.
-
Metrics are numerical values that represent some aspect of a system at a particular point in time. They are typically used to track resource usage, request rates, error rates, and other quantifiable aspects of system performance.
-
Traces provide a detailed view of the path of a request as it is processed by a system, particularly in a distributed or microservices architecture. They allow developers to see how a request is processed through multiple services, and how much time is spent in each service, helping to identify bottlenecks and performance issues.
-
Logs are records of events that a system produces while it is running. They can provide valuable insights into the behavior of the system and can be used to diagnose and troubleshoot issues.
OpenTelemetry is a set of APIs, libraries, SDKs, agents, and instrumentation that provide a single way to collect and analyze telemetry data from applications, regardless of the language or platform they are running on. It includes components for collecting and exporting metrics, logs, and traces, and provides a wide range of backends for storing and visualizing this data.
2. Monitoring Infrastructure
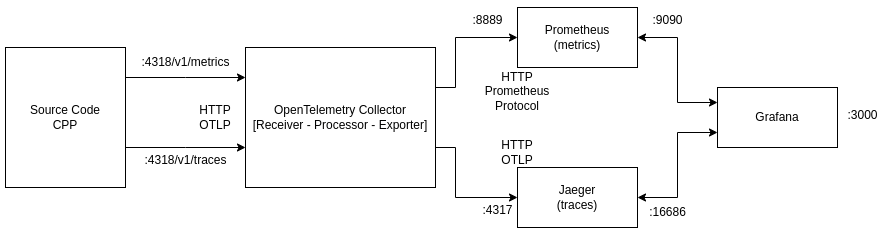
Sharemind HI’s monitoring infrastructure is comprised of several services for monitoring the system, using OpenTelemetry and other tools. Here’s a brief overview of each service:
-
OTel-Collector: This is the OpenTelemetry Collector, which receives, processes, and exports telemetry data. It uses the configuration file
otel-collector-config.yamlto determine how to process and export the data. -
Jaeger: This is a distributed tracing system. It receives trace data from the OpenTelemetry Collector and provides a user interface for viewing and analyzing the traces.
-
Prometheus: This is a monitoring system that collects and stores metrics data. It uses the configuration file
prometheus.yamlto determine which metrics to collect and how to store them. -
Grafana: This is a visualization tool that can display data from various sources, including Prometheus and Jaeger. It uses the configuration files in the
provisioningdirectory to determine what data to display and how to visualize it.
By setting up these services in a Docker Compose file, one can easily start, stop, and manage the monitoring infrastructure for the system. This can be particularly useful in a development environment, where one may need to frequently start and stop services, or in a production environment, where one needs to ensure that the monitoring infrastructure is always available and up-to-date.
docker-compose.yaml:
services:

  # Collector
  otel-collector:
    container_name: otel-collector
    image: otel/opentelemetry-collector:0.83.0
    restart: unless-stopped
    ports:
      - "4318:4318"   # OTLP HTTP receiver
      - "8889:8889"   # Prometheus exporter metrics
    volumes:
      - ./config/otel-collector-config.yaml:/etc/otel-collector-config.yaml
    command: ["--config=/etc/otel-collector-config.yaml", "${OTELCOL_ARGS}"]

  # Jaeger - Traces
  jaeger:
    container_name: jaeger
    image: jaegertracing/all-in-one:1.48
    restart: unless-stopped
    ports:
      - "4317" # OTLP HTTP receiver
      - "16686:16686" # API and Frontend
    environment:
      - COLLECTOR_OTLP_ENABLED=true

  # Prometheus - Metrics
  prometheus:
    container_name: prometheus
    image: prom/prometheus:v2.46.0
    restart: unless-stopped
    ports:
      - "8889" # Exporter metrics
      - "9090:9090" # API and Frontend
    volumes:
      - ./config/prometheus.yaml:/etc/prometheus/prometheus.yml

  # Grafana - Dashboards
  grafana:
    container_name: grafana
    image: grafana/grafana:10.0.4
    restart: unless-stopped
    ports:
      - 3000:3000 # Frontend
    volumes:
      - grafana-storage:/var/lib/grafana
      - ./provisioning:/etc/grafana/provisioning

volumes:
  grafana-storage:
To run the above stack:
docker-compose up -dAfter the provisioning of the monitoring infrastructure, among others, one can specify the following configurations in Sharemind HI:
MeterFactoryType: OTLP_FACTORY
MeterFactoryConfiguration.ExportAddress: http://YOUR_IP_ADDRESS:4318/v1/metrics

TracerFactoryType: OTLP_FACTORY
TracerFactoryConfiguration.ExportAddress: http://YOUR_IP_ADDRESS:4318/v1/traces
The whole stack configuration, including the docker-compose file, services' configuration files, and additional documentation can be downloaded from: monitoring-stack.tar.xz.
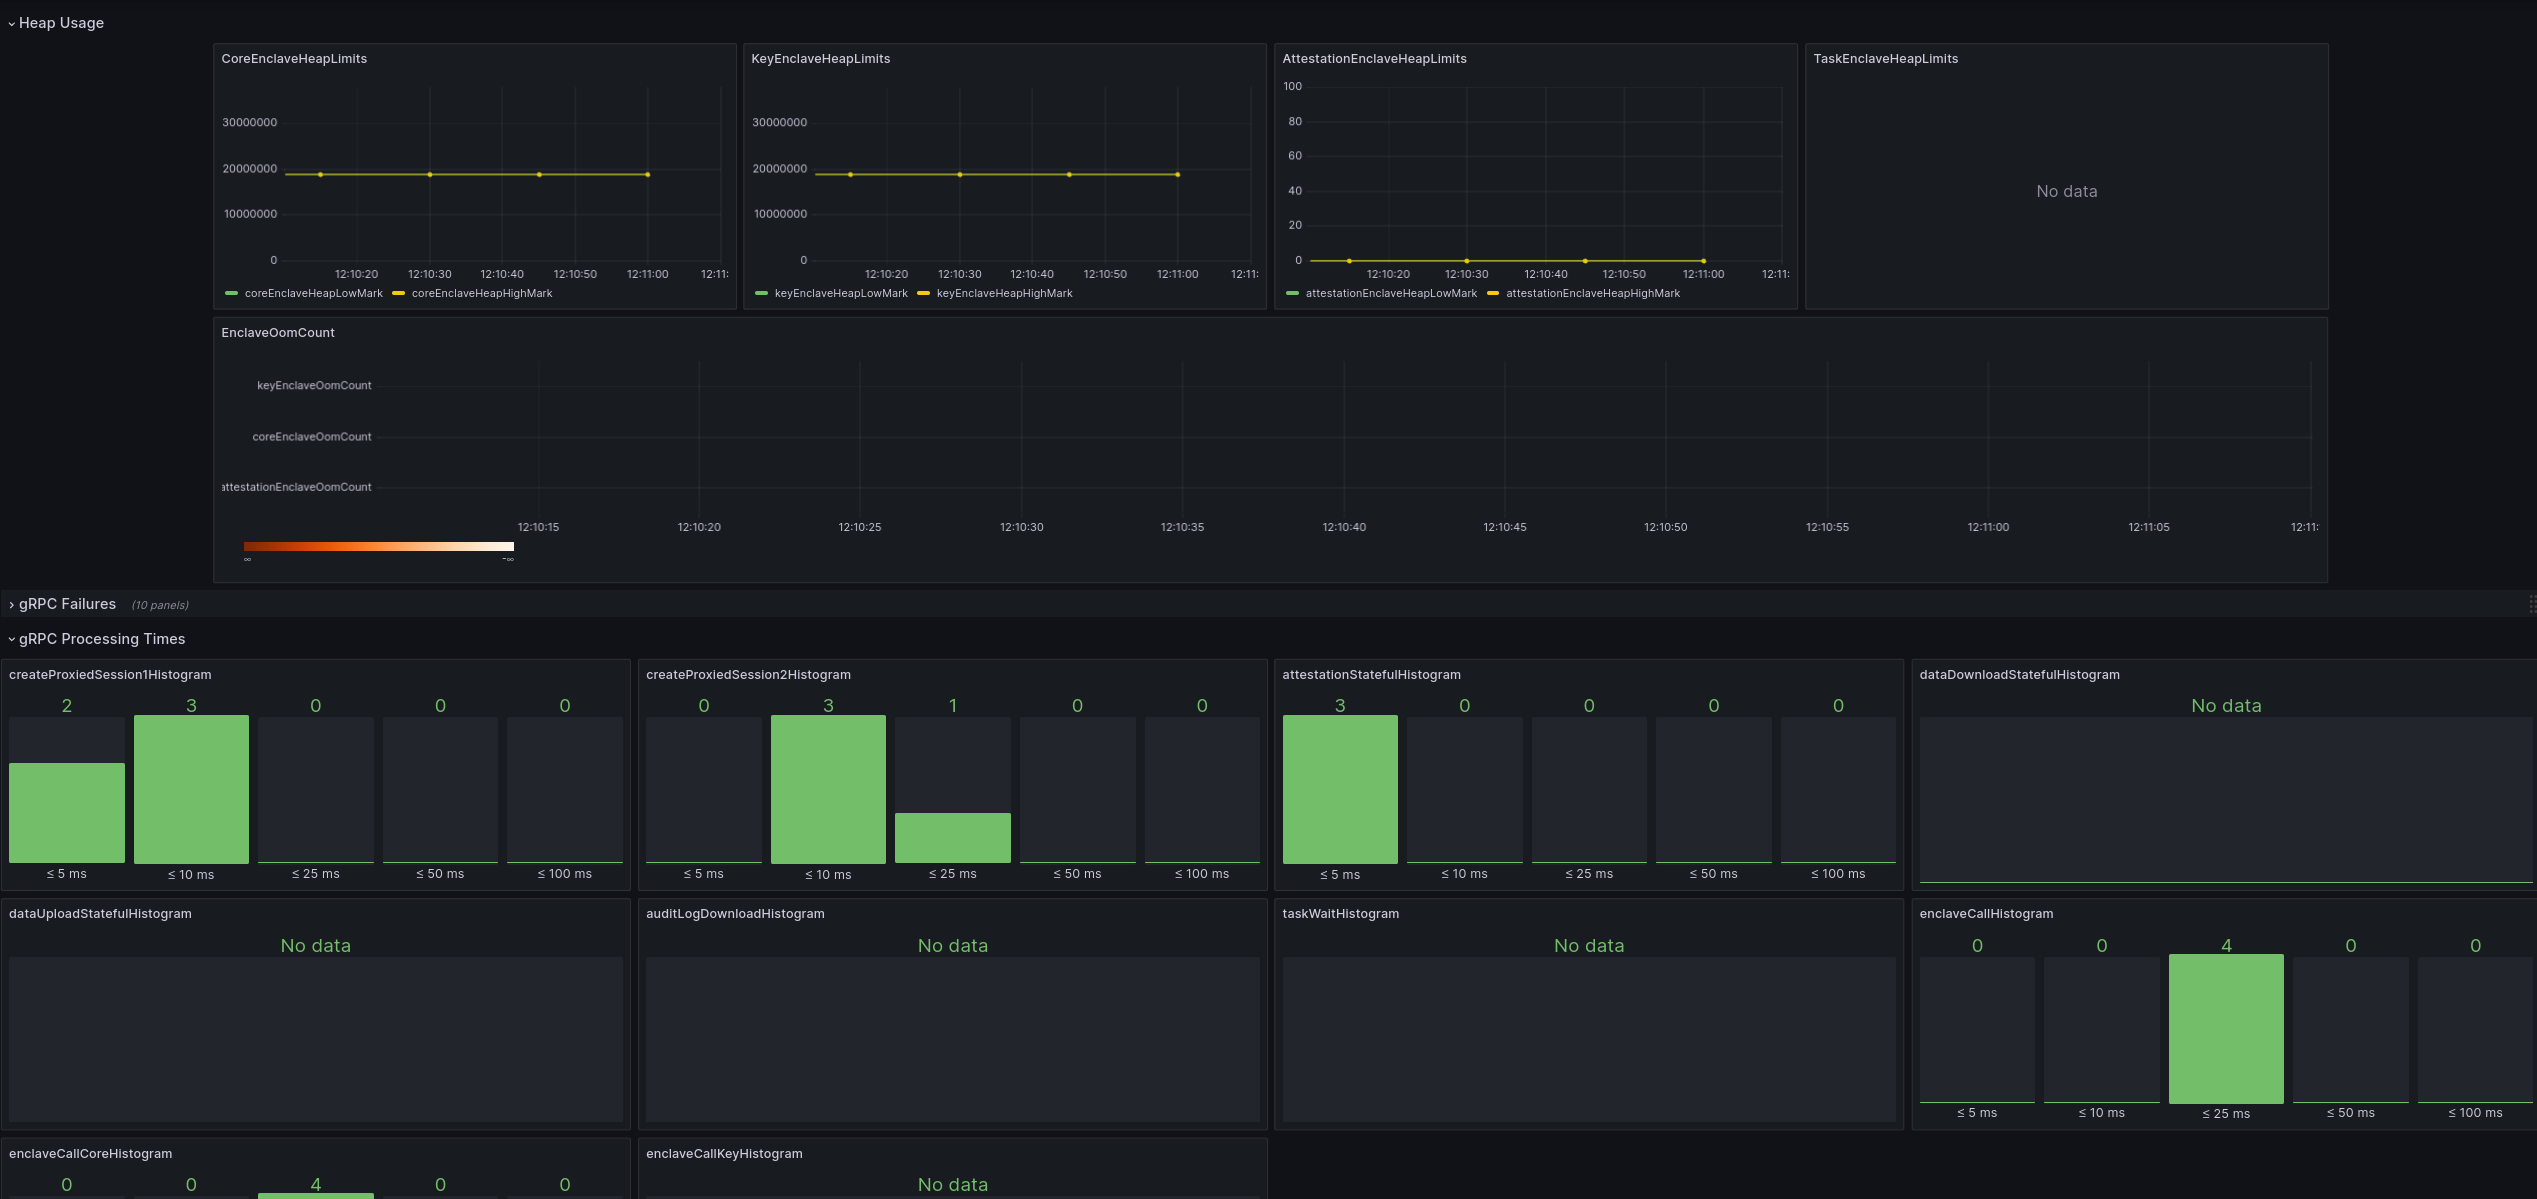
3. Grafana Dashboard
The Grafana frontend can be accessed via: http://YOUR_IP_ADDRESS:3000.
An example of a Grafana dashboard can be found in the monitoring-stack.tar.xz/provisioning/dashboards/test-dashboard.json file, which can be imported to Grafana, if not automatically imported already.
Do not forget to import, as well, the "Connections > Data Sources".
Jaeger should be connected via http://jaeger:16686, and Prometheus via http://prometheus:9090.